Demystifying Software Estimates With Probability Curves

Article by Nick Walsh — Apr 13, 2021

Expertise is comfort in the unknown. For software developers, that usually means reaching for the most important tool in their belt: “I’m not sure, I’ll get back to you.” As a specialization, the field is too wide, too fast-moving, and too situational to always have an informed opinion on demand.
When it comes to money, though, “I’ll get back to you” doesn’t work the same way. An estimate is exactly what the name implies — an educated guess — and the promise of it being clearer later isn’t reassuring for someone writing checks.
So, how do we remove a bit of mystery and intrigue from that foundational part of the process? Presentation plays a bigger role than most people expect.
The Problem With Estimating Software Development Costs
To start, let’s take a look at the underlying issue. Quoting a custom software build (especially big applications) is usually the last skill a senior-level developer picks up, due in part to:
- Working with limited information. Estimates come before the work, so they’re based on a shallow understanding of the needs, objectives, and (potentially) the domain.
- Dealing with something unique. Custom implies the creation of something that doesn’t already exist. A unique solution is bound to have a few unique problems.
- Facing an infinite number of paths. Every feature, component, and bit of code that goes into a project can be approached several ways. The right way is tied to needs and objectives — which, as the bullet point up there notes, are shallow at this stage.
Summarized, estimates are high-impact deliverables from limited information. That’s a whole topic unto itself, which we’ve (conveniently) covered previously in an article on the connection between cost and communication.
Like an already-baked dish on a cooking show, we’re going to focus on the next step: talking about the numbers.
Comparing Software Costs
Unknowns beget ranges. Ranges beget confusion. We won’t do a deep dive into anchoring here, but, for illustrative purposes, imagine that you’re looking at an early quote of $50,000–$100,000 to build out an application.
A wide spread like this can account for uncertainty on the first or second call, but it also invites three very different interpretations:
- The budget-conscious. “Perfect, this can be done for $50,000.”
- The previously-burned. “This will take at least $100,000.”
- The real intent. “Probably around $75,000. That can swing by about a third if things go really well or really poorly.”
For something as important as cost, muddy takeaways aren’t ideal. Let’s work on ensuring that everyone is reading a range the same way.
Estimating Software Development on a Curve
Enter probability distributions. We’ll start with a normal distribution (known colloquially as a bell curve), which looks something like this:
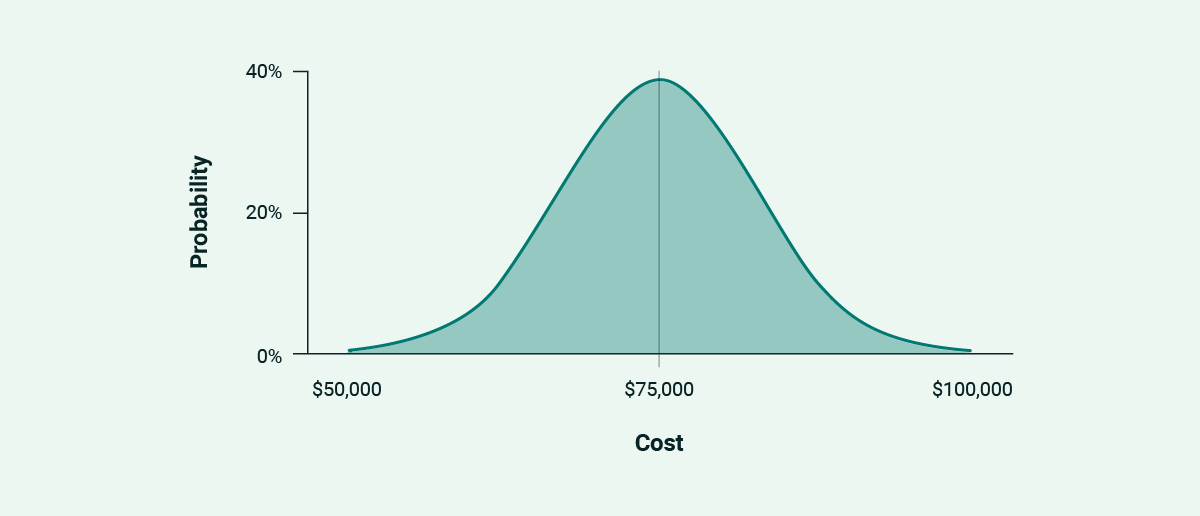
If you’ve ever been graded “on a curve,” that’s what the curve looks like. The range is still important, but the graph hammers home that every outcome across it isn’t equally possible.
Probability distributions add something tangible to the estimate, giving us a solid springboard to dive into the whys of project pricing. Chart in hand, we can break the visualization into thirds to talk through the characteristics of each part.
Lower Third
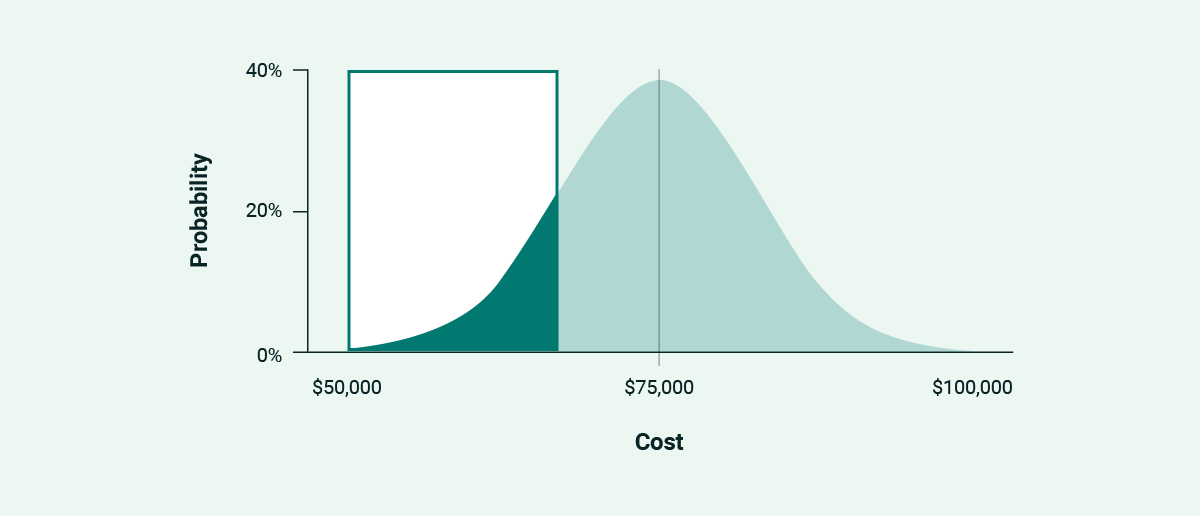
Coming in on the low end of an estimate always sounds like a positive, but what does that really mean? Projects that finish in this region:
- Start with few unknowns.
- See their unknowns resolve in a tidy manner.
- Limit feedback loops and rework.
- Really mean minimum viable.
Summed up, the lowest part of a range is a combination of laser focus, good fortune, and known quantities. It’s possible, but it’s not probable. If the desired total budget is somewhere around here, it’s a sign that requirements need to be reworked.
Middle Third
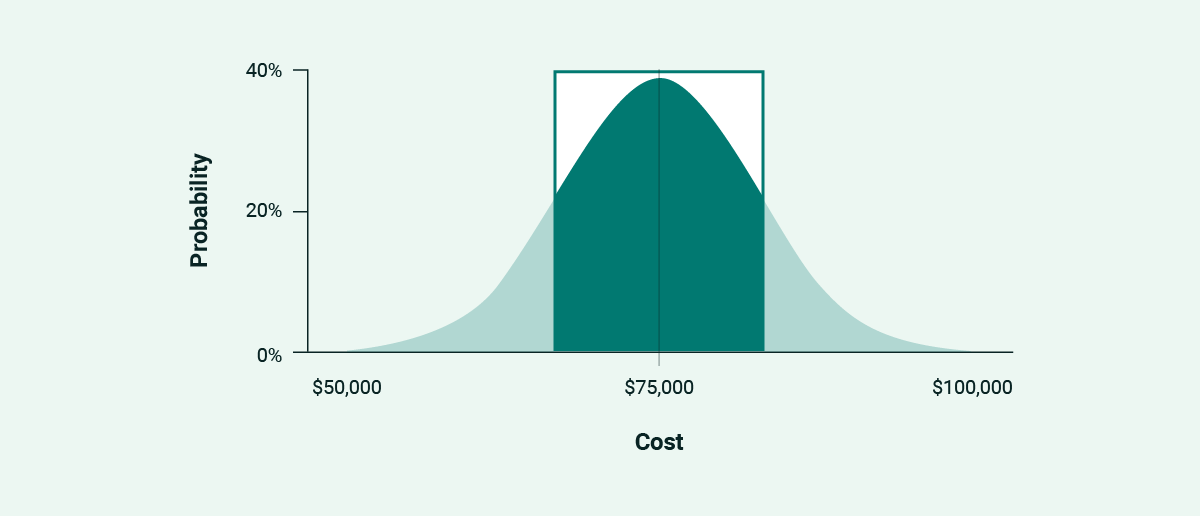
In a normal distribution, this is where most outcomes fall — 68% of them, give or take. These projects:
- Have a reasonable number of unknowns.
- Are mixed challenges. Some unknowns resolve quickly, others are a bit of a hurdle.
- Carry moderate rework and iteration pre-launch.
- May see a couple nice-to-haves sneak their way into the requirements.
Reasonable, moderate, middle. This is where a project likely winds up, with a more realistic take on scope than the cut-and-dried lower third. It’s a safer region to budget for if there are contingencies for problematic features that threaten to step over the reasonable line.
Upper Third
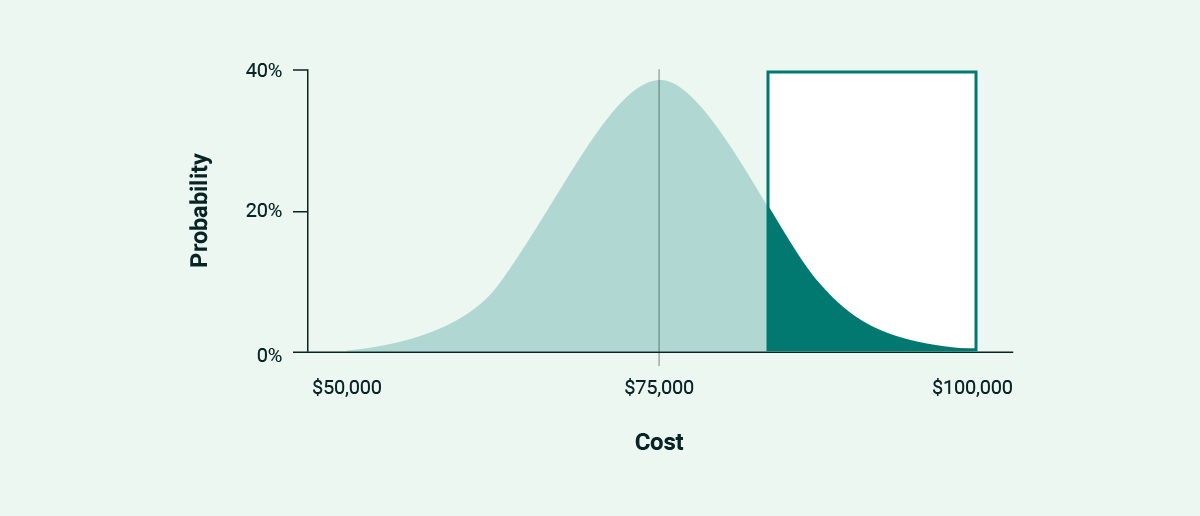
If everything can go right, it can also go wrong. Builds in the top third:
- Have a large number of impactful unknowns.
- Require significant effort to resolve those unknowns.
- Gain new domain information during the build, creating rework or concept tweaks.
- Include pet and stretch features that move it beyond minimum viable.
The upper limit looks to capture the threat of change and a lack of clarity. If requirements stay static as they fight back against being built, this region represents the danger.
The Benefits of Probability on Software Estimates
So, we’ve taken a look at the reasons a project will hit a particular part of our normal distribution, but why bring probability theory and statistics into this at all? These are the main benefits of adding a companion visualization.
Central Focus
First, foremost, most importantly, and all that: We’re pulling focus from the extremes. Pricing ranges are built with the center in mind, and a normal distribution shares that outlook (68% for the middle third, as we’ve covered). Possible and probable are separate ideas, so the bulk of the conversation should happen with the middle in mind.
Embracing Change and Pricing Realities
I received a great piece of feedback during a recent new project discussion:
I appreciate that you’re not saying no to anything yet.
The uncertainty in ranges isn’t ideal. For a new idea, however, they’re a means to operate in the unknown — a way to push decisions off for more research and testing. Adding a curve gives some clarity to the range while leaving the door open for ideation and collaboration.
Anchoring the Conversation
Visualizations solve everything, right? Not really, but visualizing outcomes makes it far, far easier to reason about why a project will fall in a particular range or region.
It’s possible a project could fall into the lower third, for instance, but there’s a list of reasons why it shouldn’t be considered probable.
Other Distributions
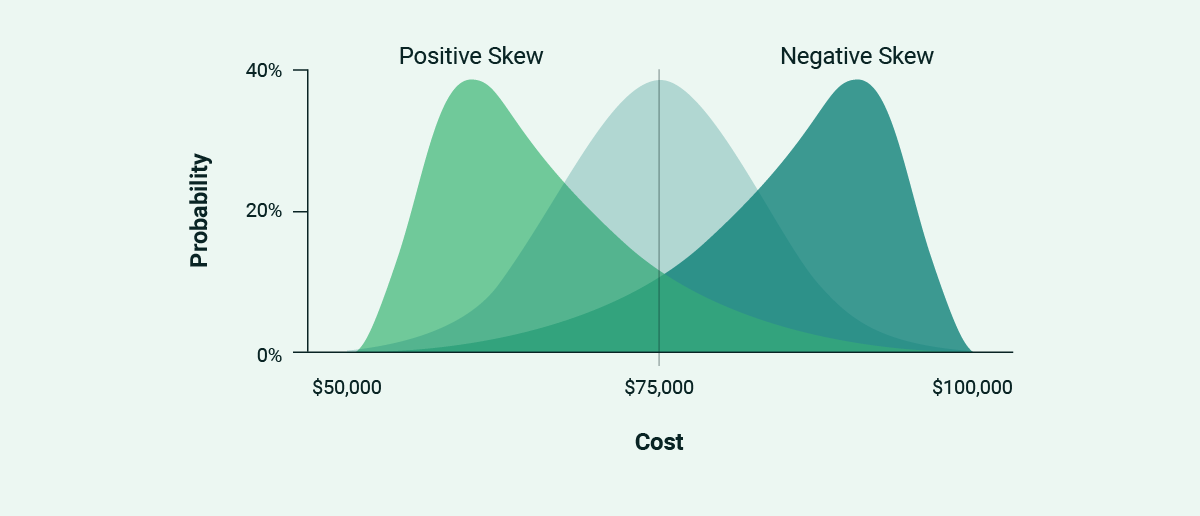
Normal distributions are just the tip of the probability curve iceberg. If the unknowns seem to be tipping the scales one way or another, a different look for our area chart helps illustrate the point.
It also keeps the estimator honest. From experience, the further we move away from a normal distribution, the more likely that our range is incorrect in the first place.
Visualizing Software Estimates
Custom applications come with custom challenges and unknowns. Unknowns are a tricky pricing hurdle — they’re resolved after work begins, so pricing really is an estimate until both sides lay out their domain expertise and find the right solution.
Ranges help here, but they have issues of their own. Recipients will usually focus on one extreme or the other, but neither is the anchor point of the story being told.
In reality, pricing ranges are more like probability curves than a flat line: Outcomes from one end to the other aren’t equally possible. By pulling in a visual, we’re able to focus the conversation on the center, and gain a starting point for explaining what each outcome requires.
Up Next —
How Design Systems Make Teams Work Smarter, Not Harder
Design systems improve the development process by removing guesswork from building UIs and encouraging collaboration between different disciplines.
Read this Article →
